


MAXQDA Standard
Advanced qualitative & mixed methods research for Windows and Mac. Comprehensive qualitative data analysis for researchers working with diverse data sets. MAXQDA Standard works with a wide range of data types and offers powerful tools for advanced coding, retrieval, transcription and visualization, while still being easy to learn and use.
Wide Range of Data
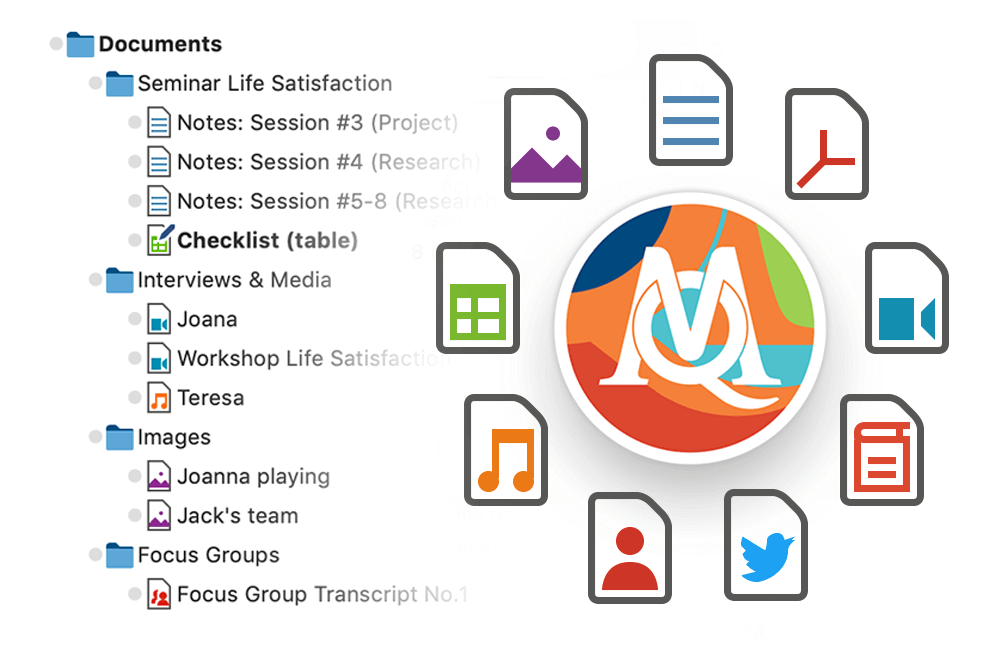
Use MAXQDA to manage your entire research project. Import data from interviews, focus groups, online surveys, web pages, images, audio and video files, spreadsheets, bibliographical data and even YouTube comments and Twitter tweets easily.
Organize your material in groups, link relevant quotes to each other, and share and compare work with other members of your team. Your project is always flexible and your code system can be expanded or refined, just like your research.

Code and Retrieve
Mark important information in your data with different codes by using regular codes, colors, symbols, or emoticons. Code quickly via drag & drop or with automatic coding for search words and organize your thoughts and theories in memos that can be stuck to any element of your project.
Retrieve coded segments quickly and efficiently with just one click, or make use of powerful search tools to test and develop new theories.
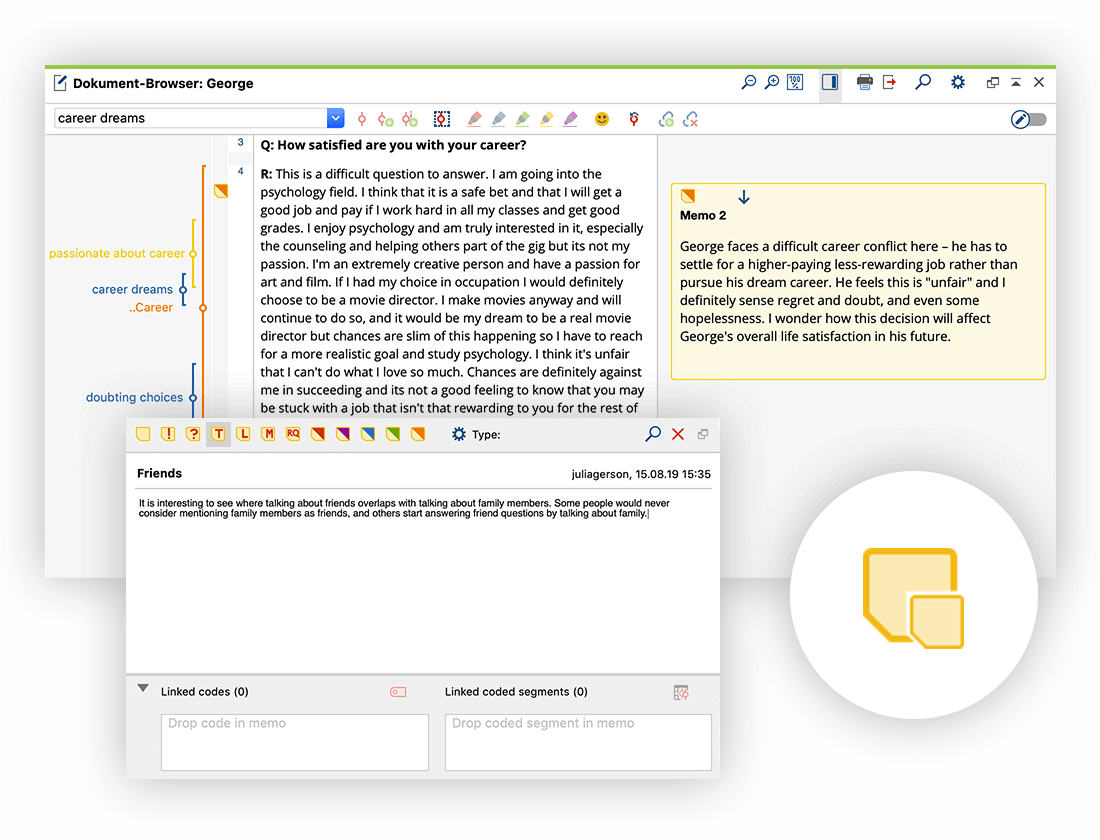
Memos
Great ideas often come up when you’re reading and coding your data. Memos are the perfect place to keep them. Choose from 11 different icons to mark your memos. The unique MAXQDA memo manager and a lexical search function guarantee immediate access to every single memo at any time. Memos are also great for creating audit trails or paraphrasing passages into your own words.
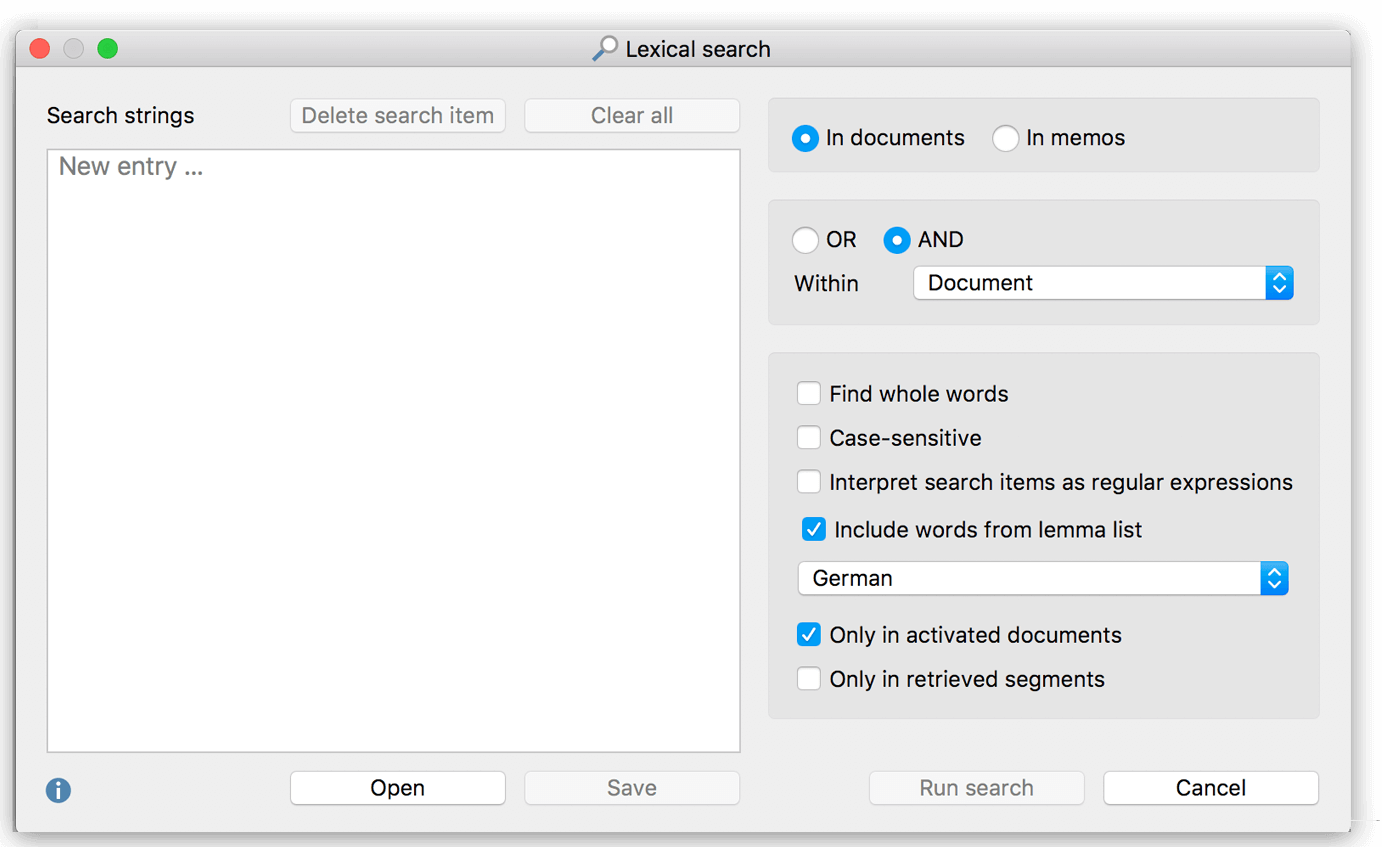
Search
Project wide searches within documents, memos or current retrieval results. You can type in single or multiple search strings and combine them using operators. Quickly scroll through each appearance of phrases with an interactive search result display and apply a code to all or selected search results. Of course you can also do a quick search in every single window of MAXQDA.
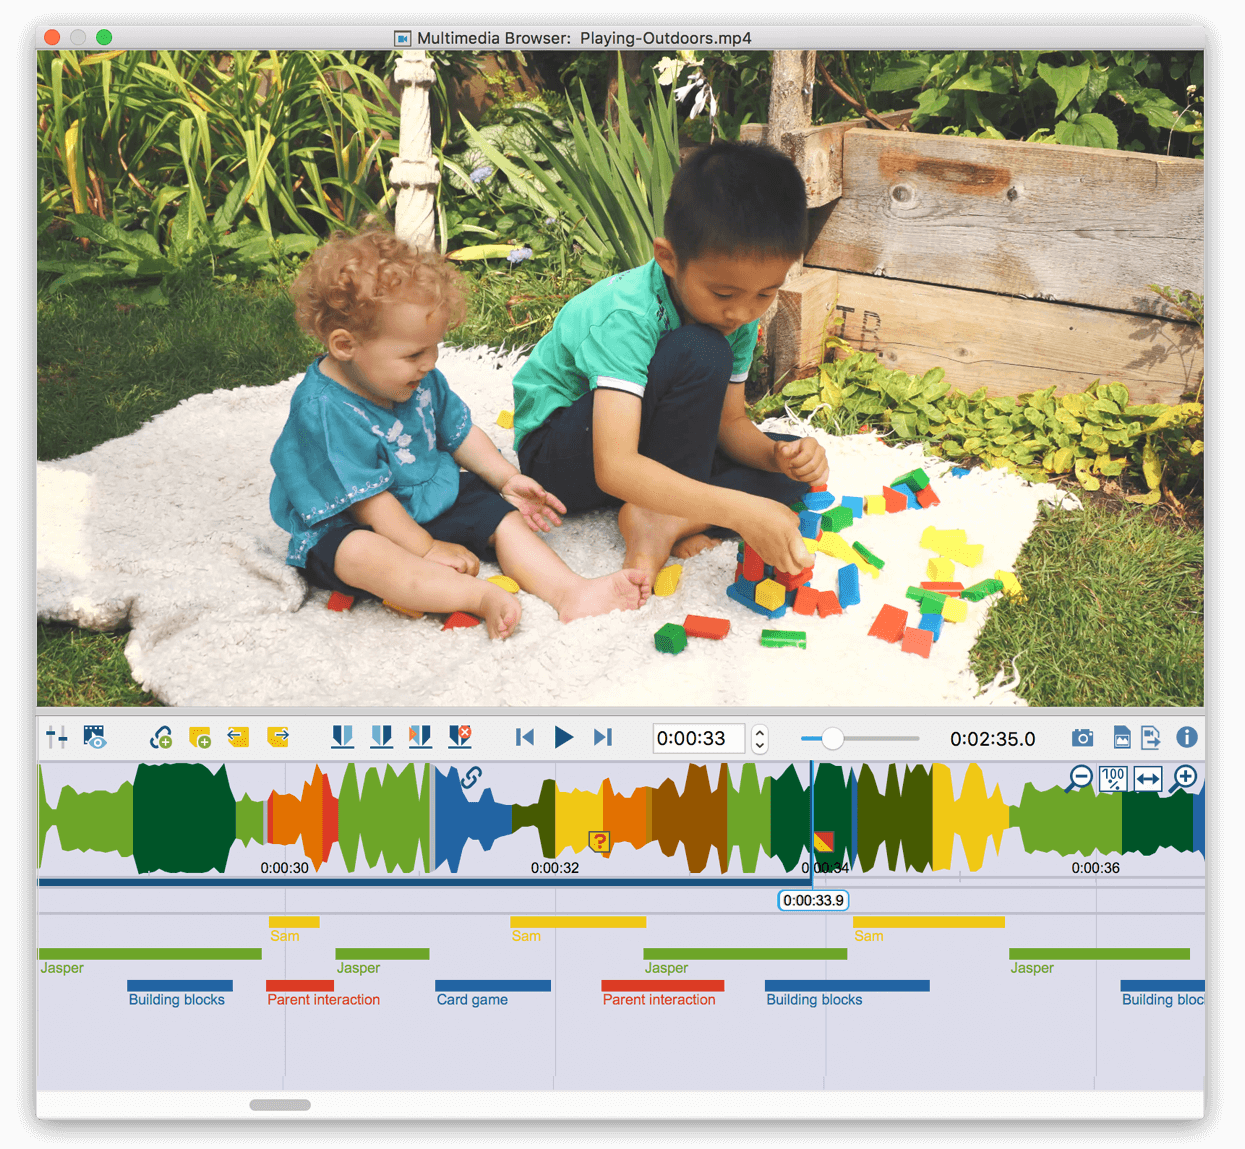
Analyse and transcribe media
It’s your choice: Use MAXQDA to code audio and video files directly without creating a transcript first. Or transcribe your media to analyze the written text instead – while always staying connected to the original media clips. MAXQDA has extended transcription functions with which you can adapt the speed or the sound volume of your audio and video files and use foot pedals to speed up the transcription.
Media clips are treated like any other segments in MAXQDA. You can code, retrieve, comment and assign a weight to these segments in the same way as with other segments.
The Mixed Methods Expert – Integrate demographics
Integrate quantitative methods or data deeply into your project. Link qualitative data to demographic variables, quantify the results of your qualitative analysis, calculate statistical frequencies, or compare groups based on quantitative as well as qualitative findings.
Visualization and Theory Testing
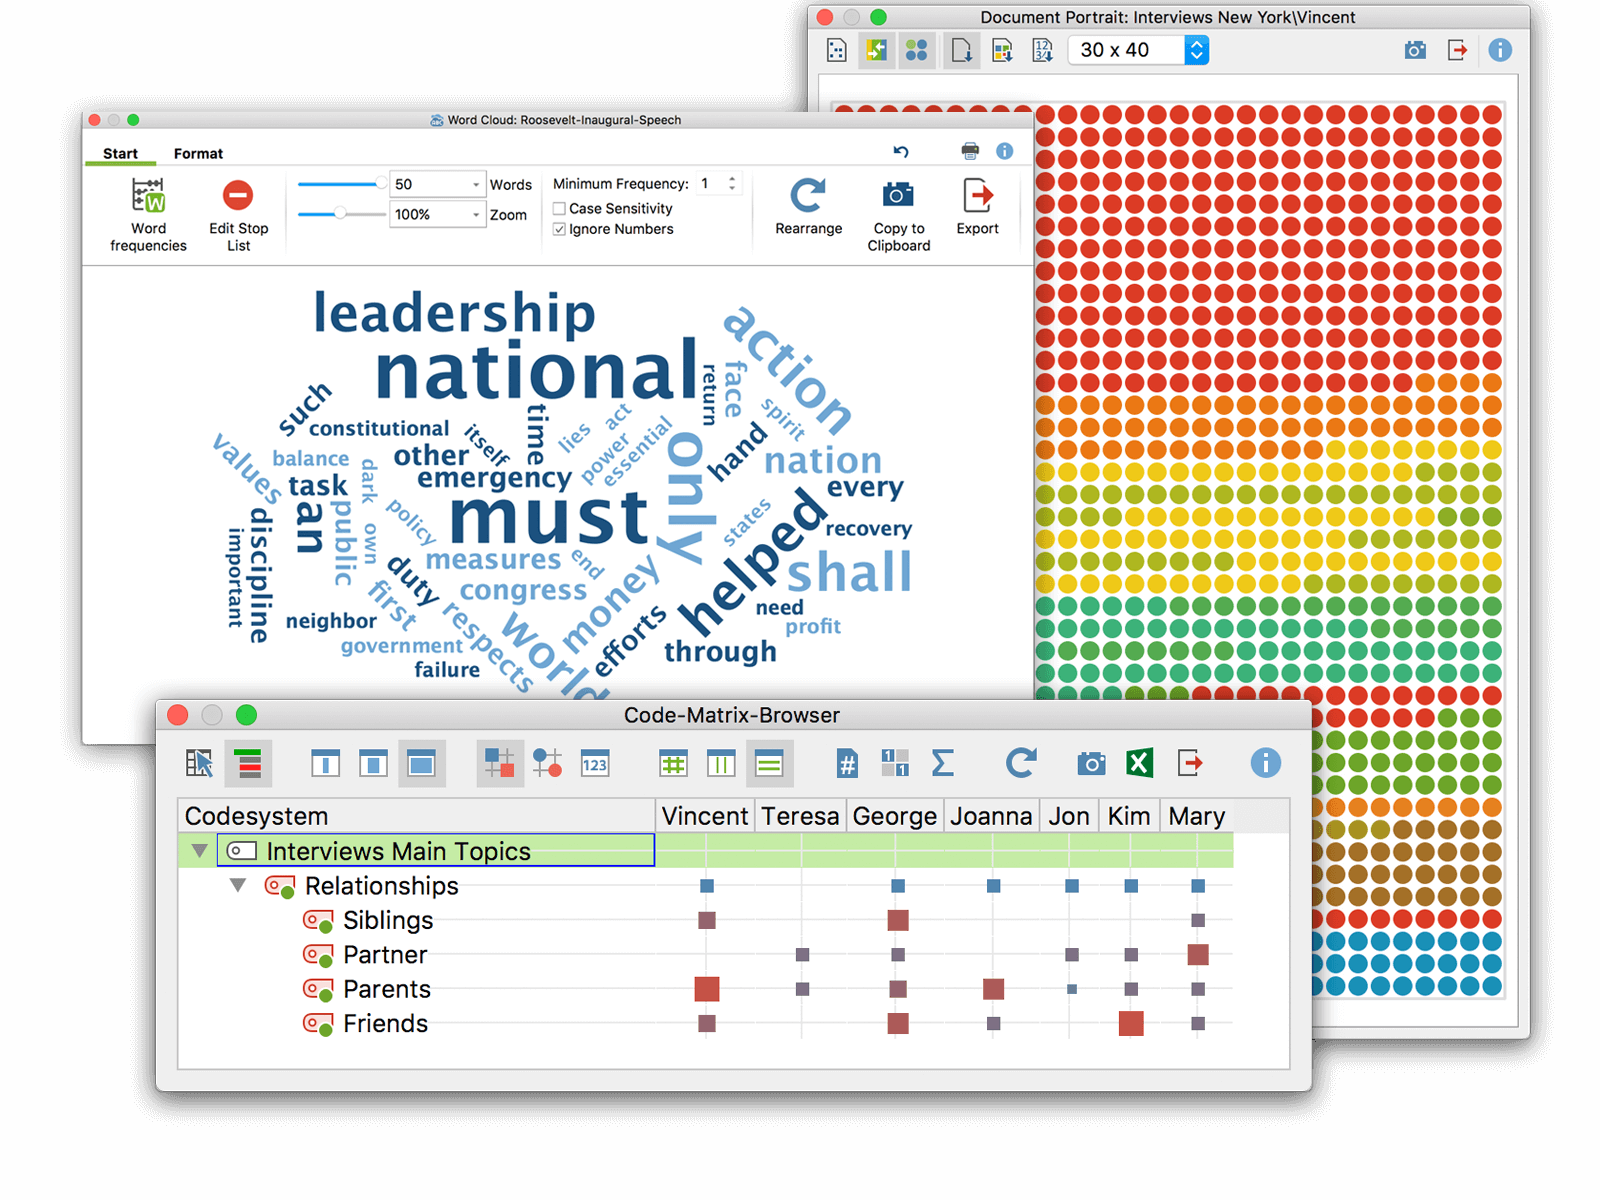
Automatically or manually generate stunning visualizations of your data. Look at your data from a completely new perspective for new insights or theory testing.
Share your results by exporting them into impressive images to use in your reports and presentations. Or create extensive maps with the on-board mapping tool MAXMaps.
Export, Report, Archive
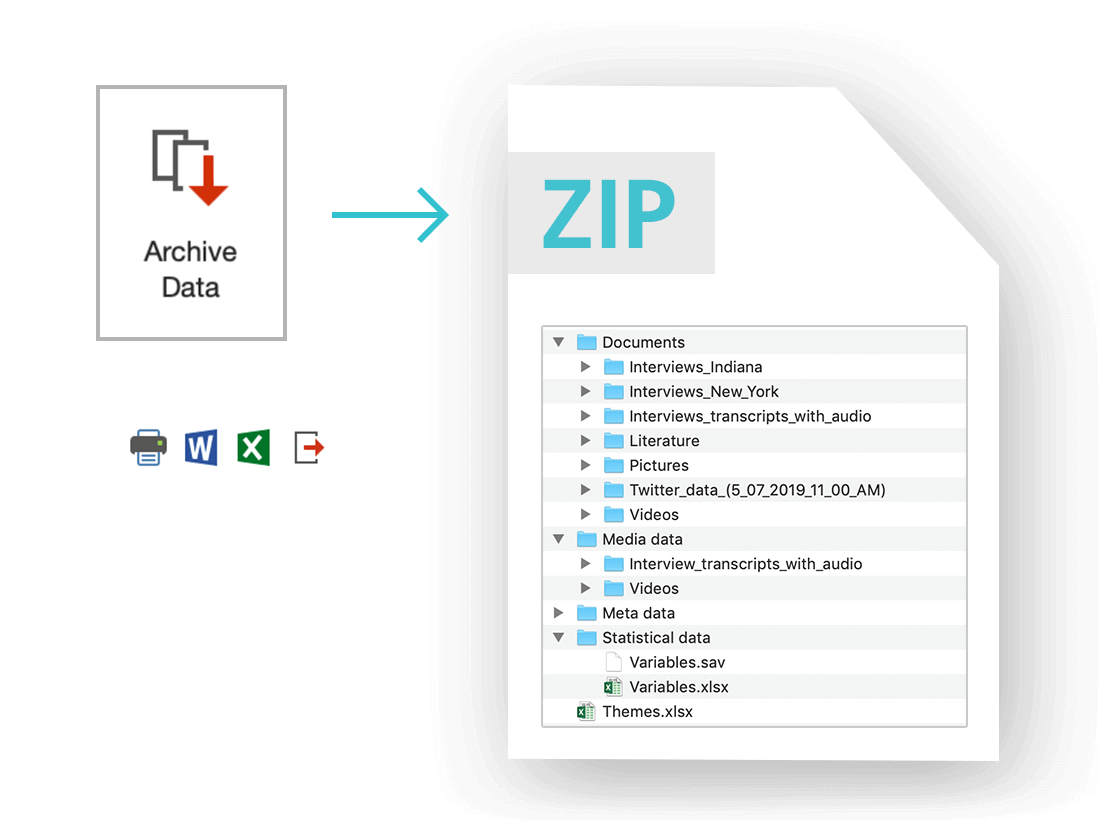
MAXQDA does not lock your data in. Export parts of your project, single documents, search results or the whole project into easy readable file formats, like Excel, Word. Or export complete projects into a clear and understandable folder structure.
MAXQDA also follows the REFI-QDA standard, which allows you to export and import data from other QDA software packages.
Work with any Language in MAXQDA
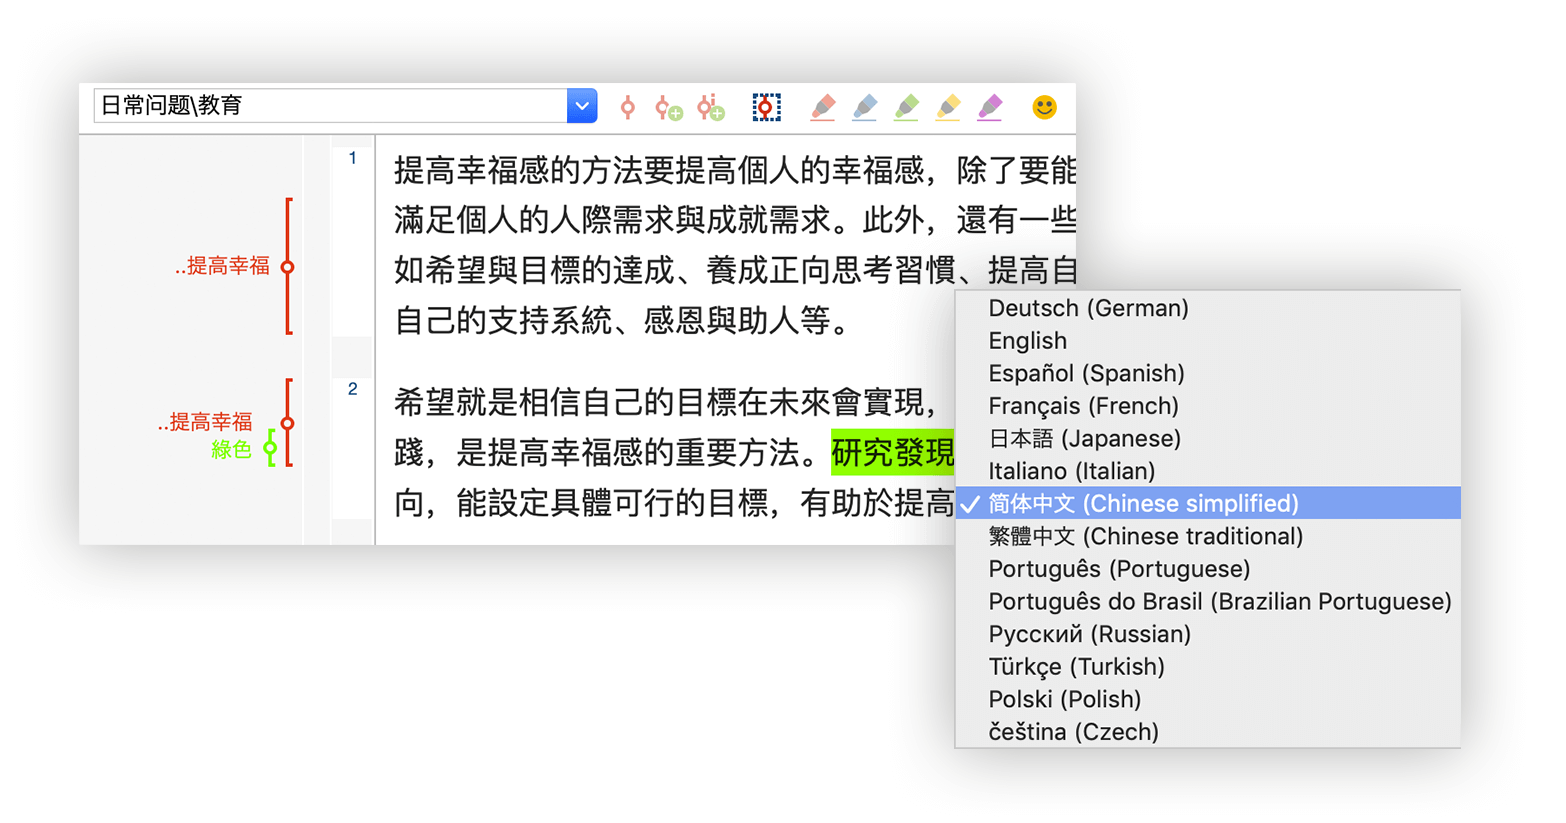
MAXQDA offers a variety of possibilities to work with different languages. Not only is the User Interface available in numerous languages but also your analysis can be conducted in every single language of the world. The fact that MAXQDA supports Unicode makes it possible to import and analyze documents in any script and language.
Learn how to use MAXQDA in your preferred language! Our Getting Started Guides are available in many different languages. Additionally, our international Professional Trainer Network provides the opportunity to participate in MAXQDA Workshops in lots of different languages.
MAXQDA Plus
KWIC, vocabulary & dictionary based analysis Desktop-based for Windows & Mac. MAXQDA Plus adds the MAXDictio module to the advanced qualitative analysis features of MAXQDA Standard. The MAXDictio module enables researchers to facilitate a vast range of procedures for quantitative content analysis. Included are tools for visual text exploration, content analysis, vocabulary analysis, dictionary based analysis and more.
Visual Text Exploration
Whether you are analyzing a single speech or an entire bookshelf: MAXDictio in MAXQDA Plus allows you to explore the content and structure of your texts without needing to read or code a single sentence in advance.
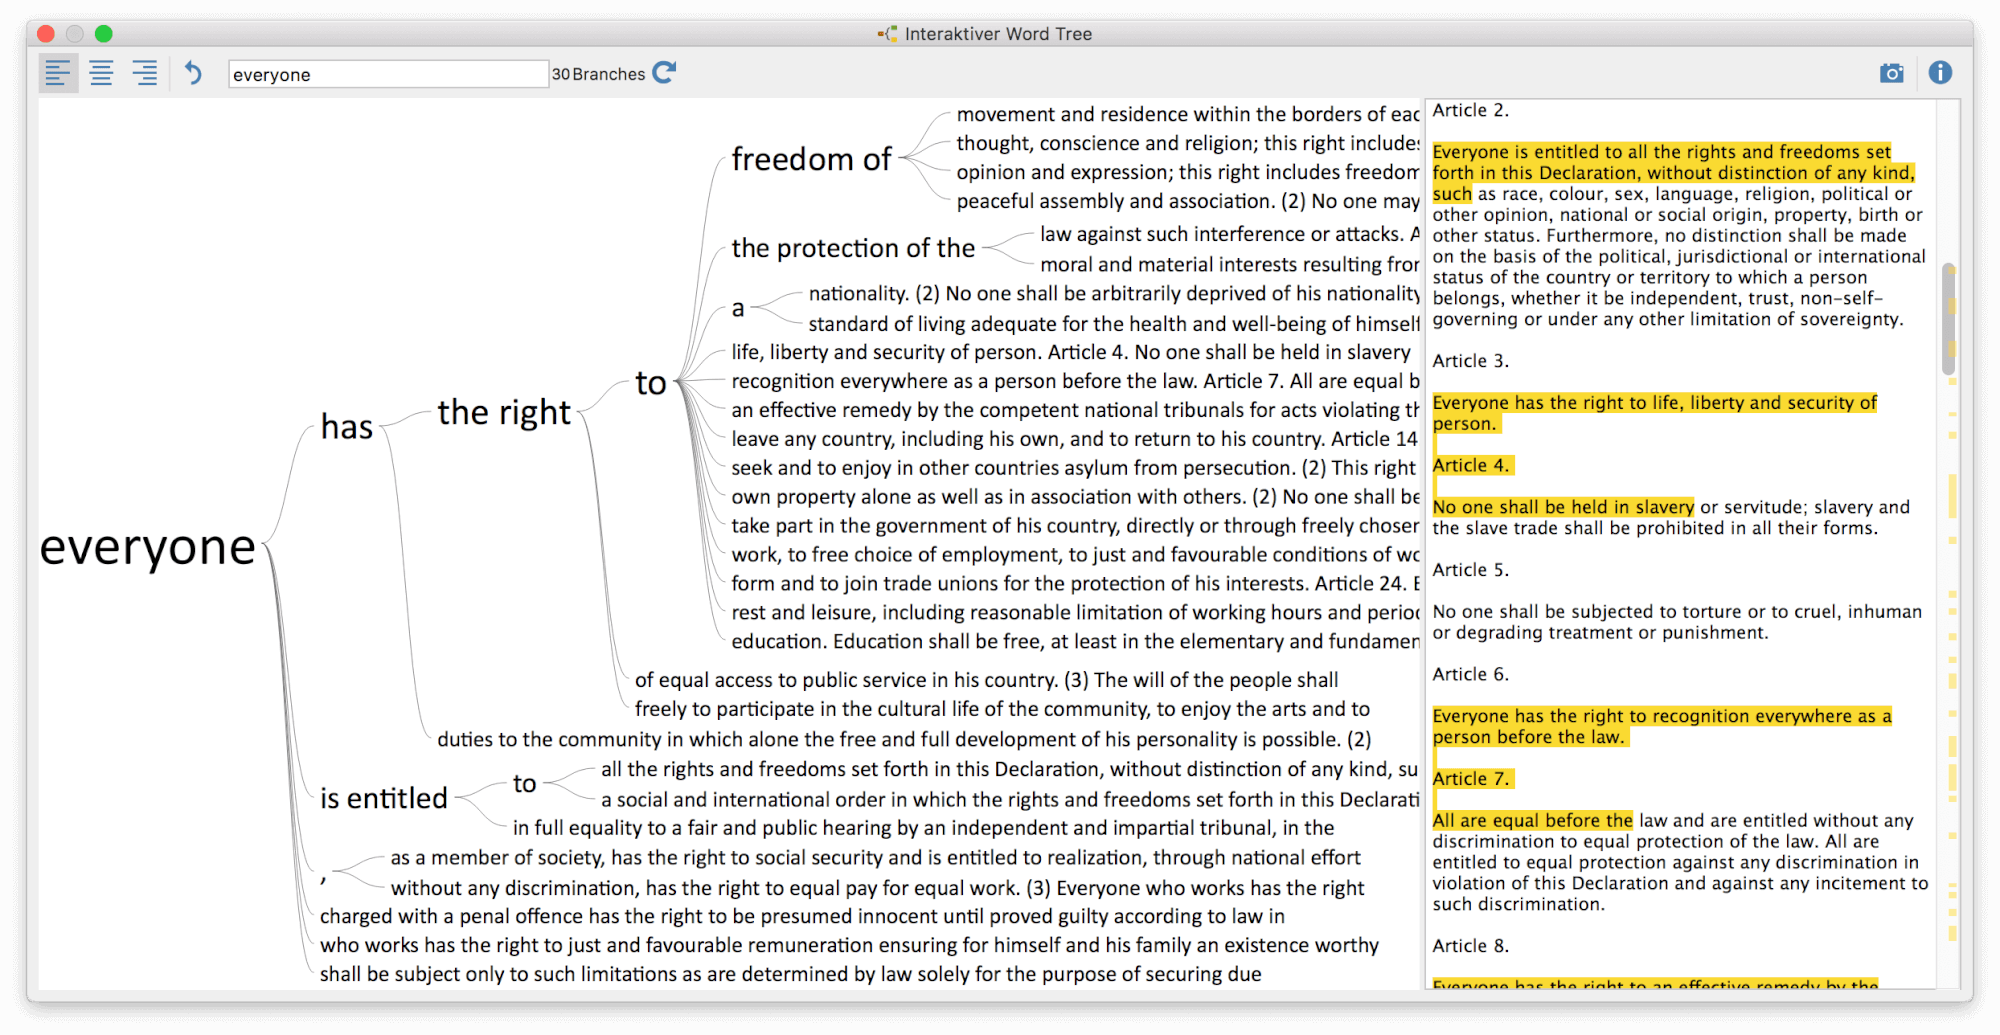
Take our Interactive Wordtree for example: It visualizes all the combinations that lead to or from any word of your choice, including a detailed display of frequencies.
This incredibly powerful feature can provide new and fascinating perspectives even on texts you know well and allows for a comprehensive overview of those you don’t.
Content analysis: From single words…
Whatever your style of research or unit of analysis: MAXDictio provides the tools to suit your needs.
Are you interested in the use of certain terms in your material?
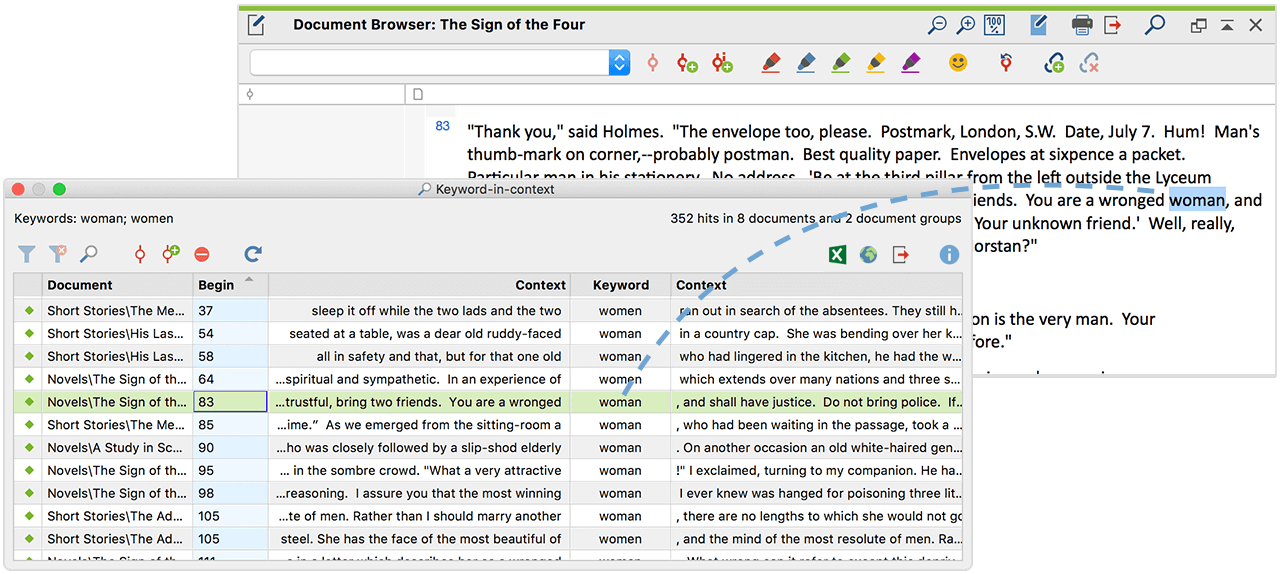
Use the “Keyword-in-context” feature to display all word locations and their (freely definable) context in an interactive result table. One click is all you need to jump to the original passage in your document browser.
… to entire word combinations
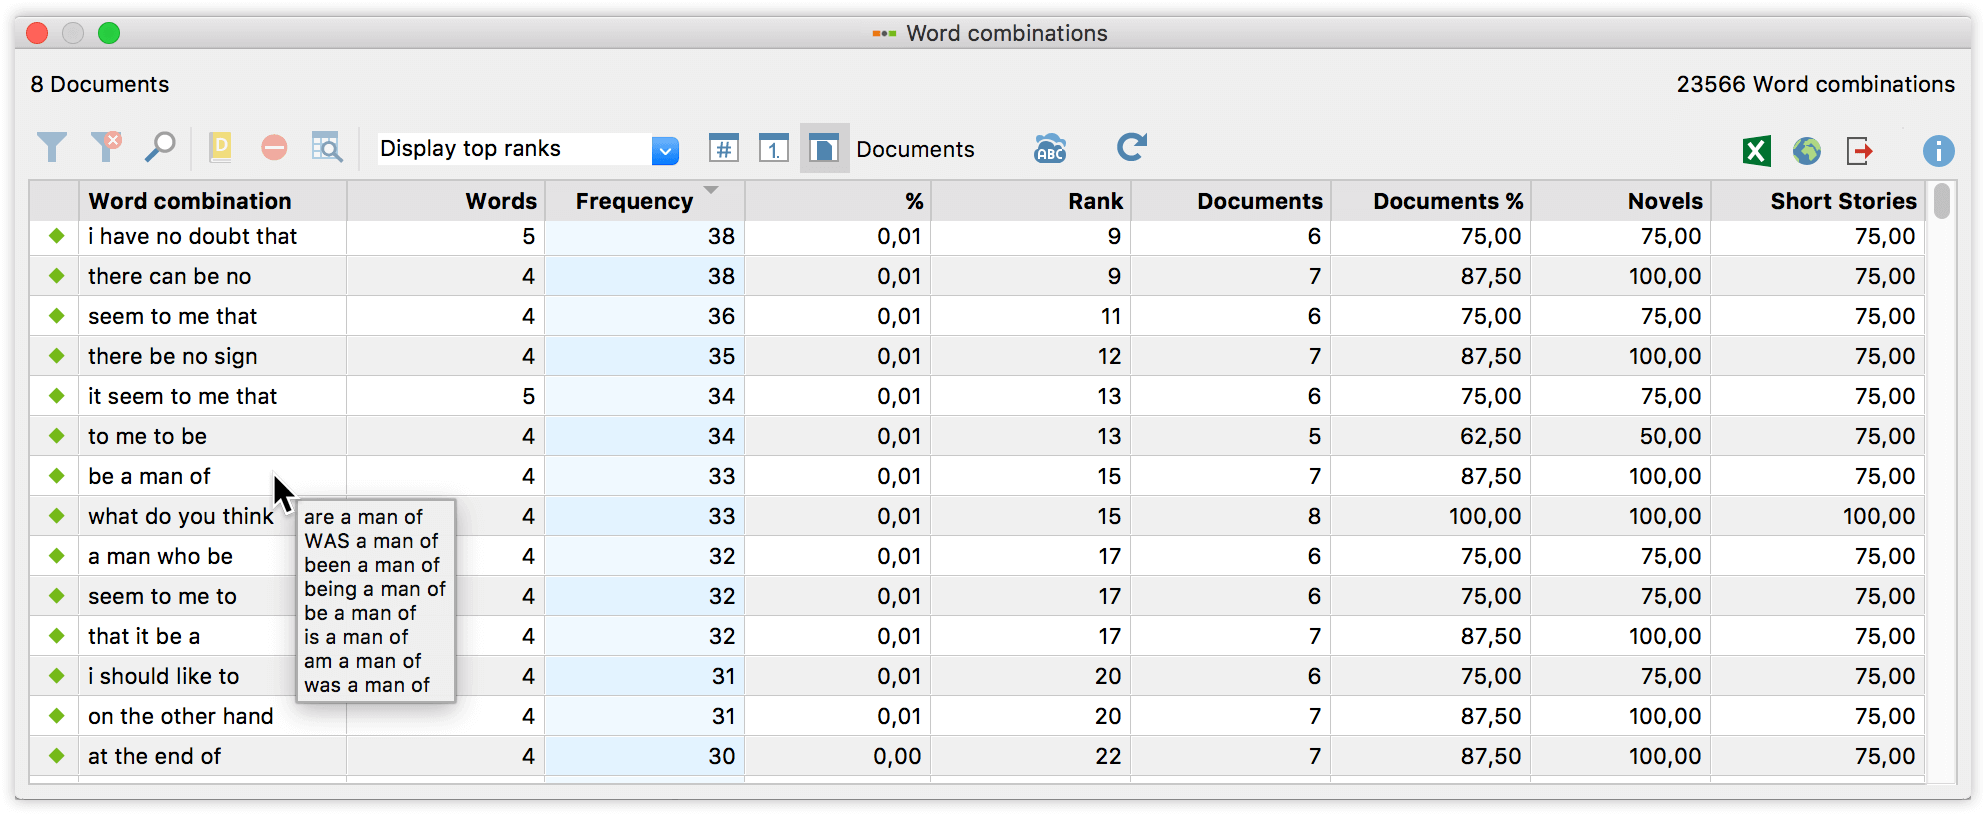
Or you can check out the frequencies, ranks and distribution of word combinations and filter them according to your own interests. The advanced options allow for lemmatization (summarizing words that share the same stem), the use of stop lists, the dissection of your material in conjunction with variables or codes, and much more.
Vocabulary analysis
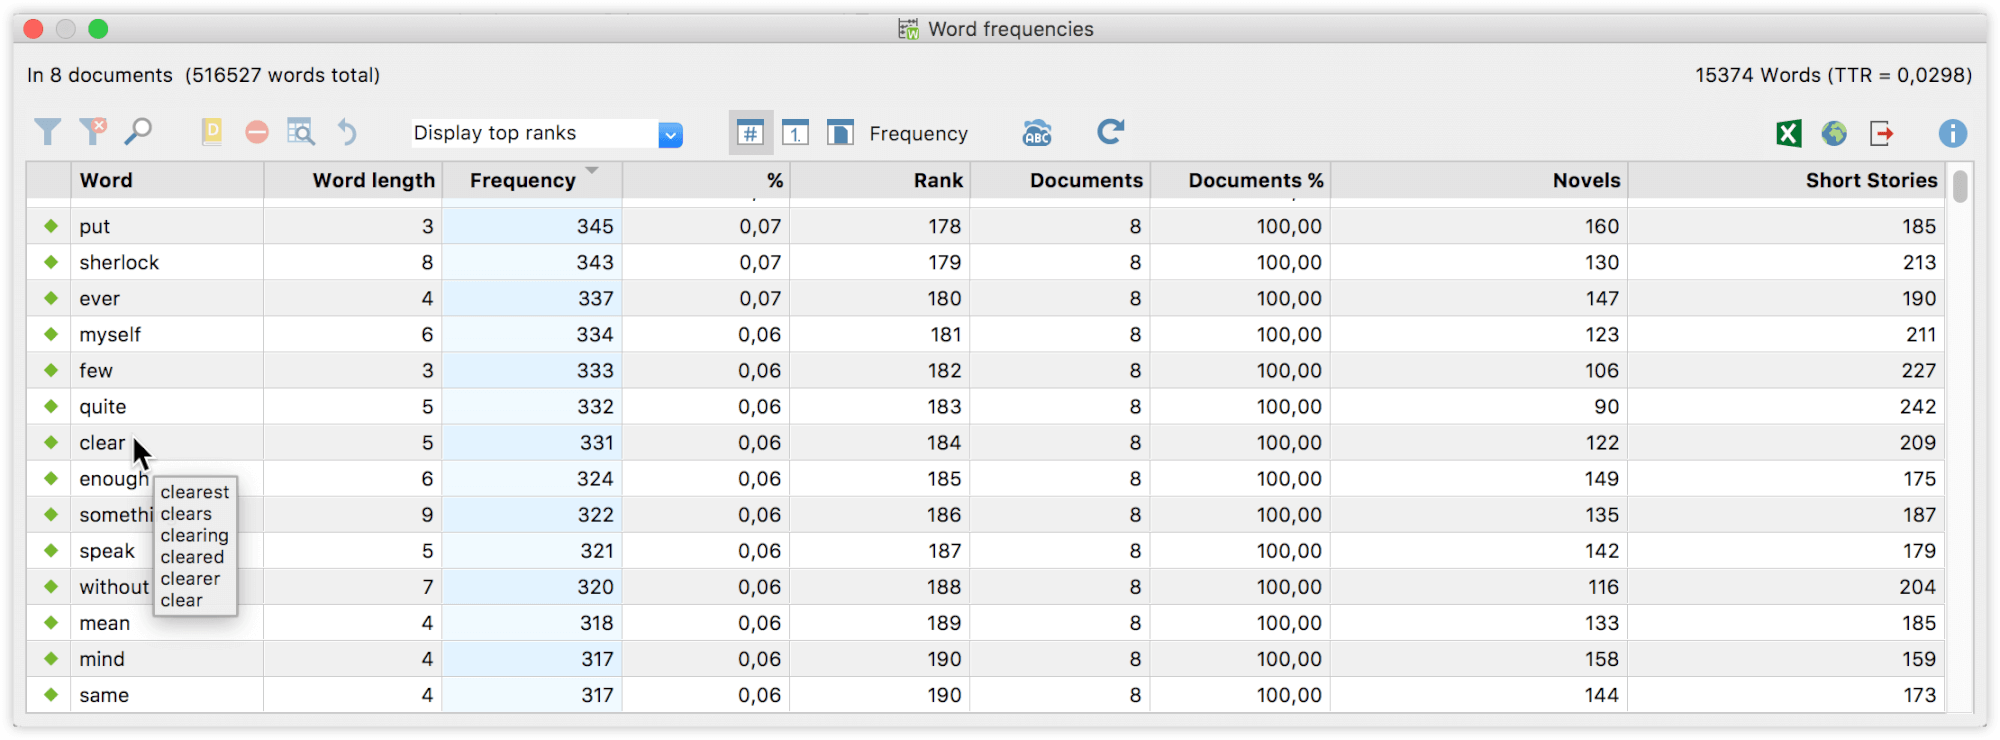
Of course you can also use MAXDictio to analyze frequencies, ranks and the distribution of single words in your material. Lemmatization and the use of stop lists and go lists is included, as well as the option to analyse your material in conjunction with variables or codes.
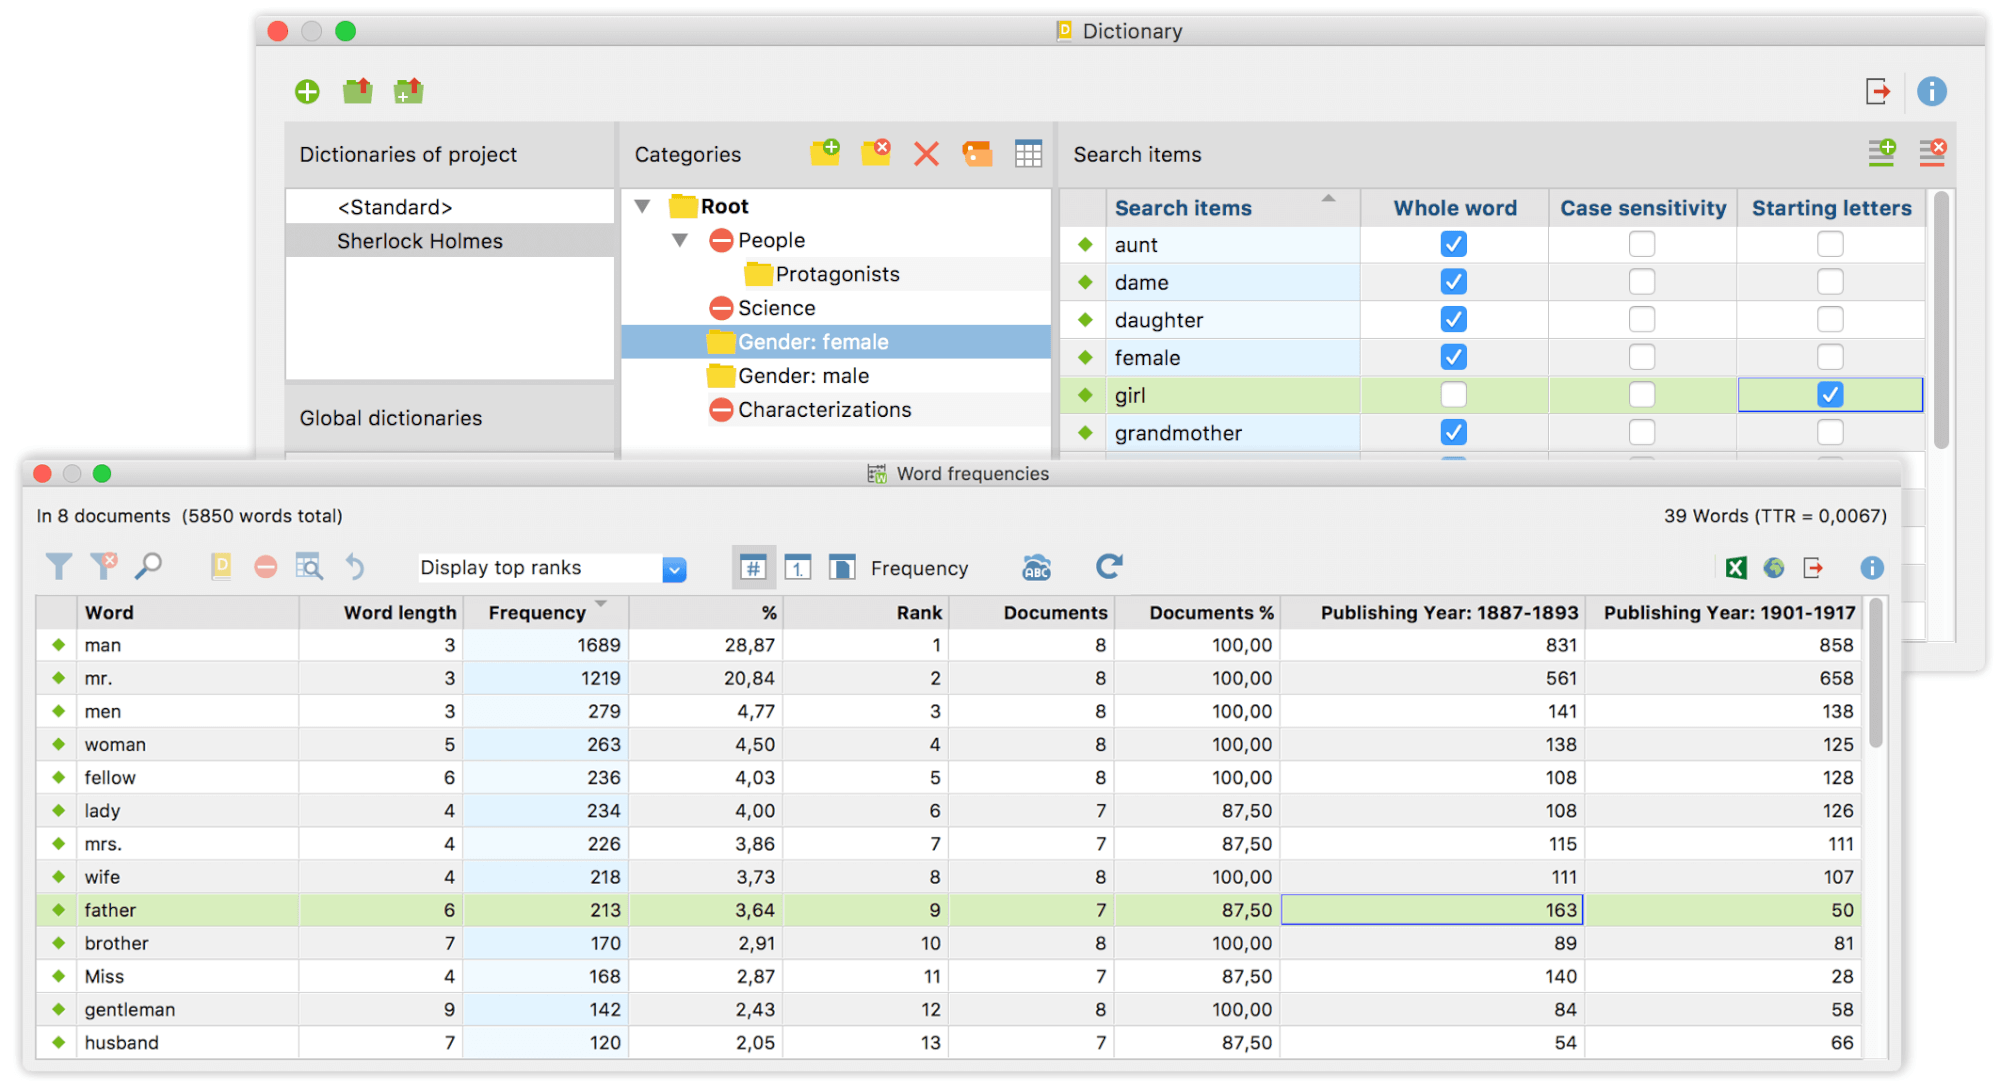
Dictionary based analysis: define categories …
Our dictionary features allow you to define categories of search terms, the occurrence of which you can then measure and compare. Whether you drag-and-drop terms from a result table, type them in, import them from a file or automatically derive them from codes: you’ll have lots of opportunities to process them further. You can compare the frequencies, ranks and distributions of your specified search terms with each other …
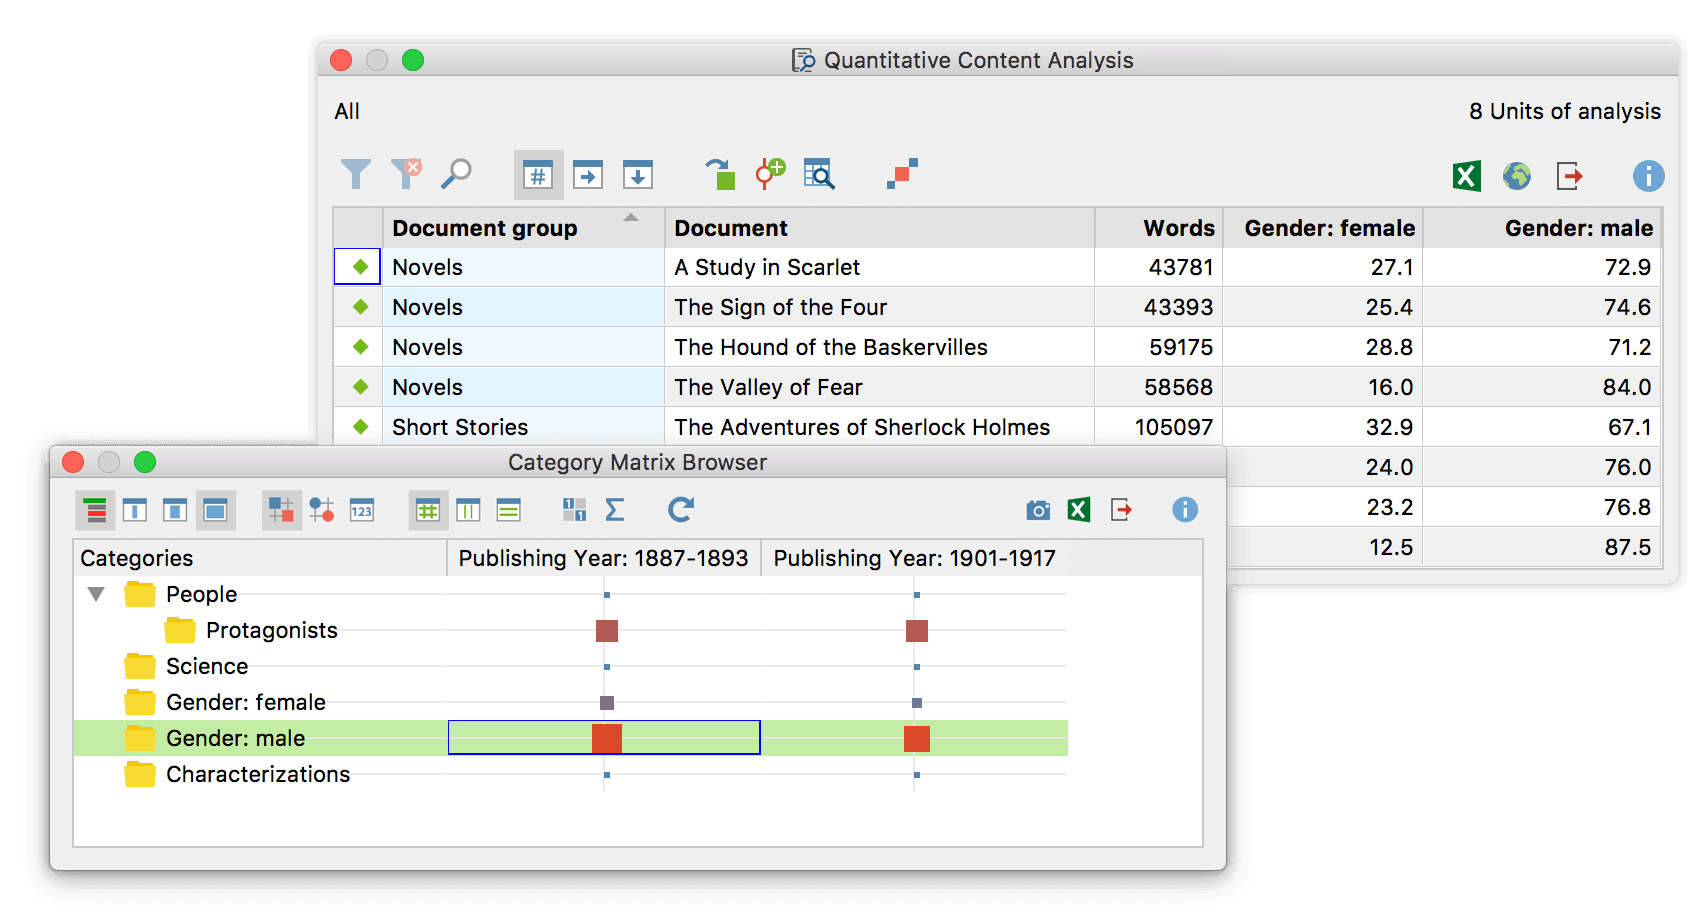
… and discover their value
… or analyze the frequencies for entire dictionary categories. Use the Category-Matrix-Browser to visualize your findings. If you want to continue your analysis on another level, you can automatically code your categories and all your search terms, or transform them into document variables.
And more

MAXDictio allows you to analyze Japanese texts, makes it easy to manage multiple stop and go-lists, and quickly creates a tag cloud for every piece of your material you are interested in. Every result table is interactive which means that you just need one mouse click to jump to the original passage in the document browser or that you can drag-and-drop results from frequency tables into your dictionary. You can also code your search results with a new or existing code and include as much context in words, sentences or paragraphs as you like. Or you can export your results as excel or even as html files.
MAXQDA Analytics Pro
– Introducing ‘Stats’ Module
Statistical analysis meets qualitative research – Desktop-based for Windows & Mac. MAXQDA Analytics Pro equips you with a large range of tools for statistical analysis. Seamlessly quantify your qualitative data and enrich your analysis with evidence and plausibility. Statistically analyze your qualitative data in MAXQDA or import and connect your data with data sets in the Excel or SPSS format.
Data Compatibility
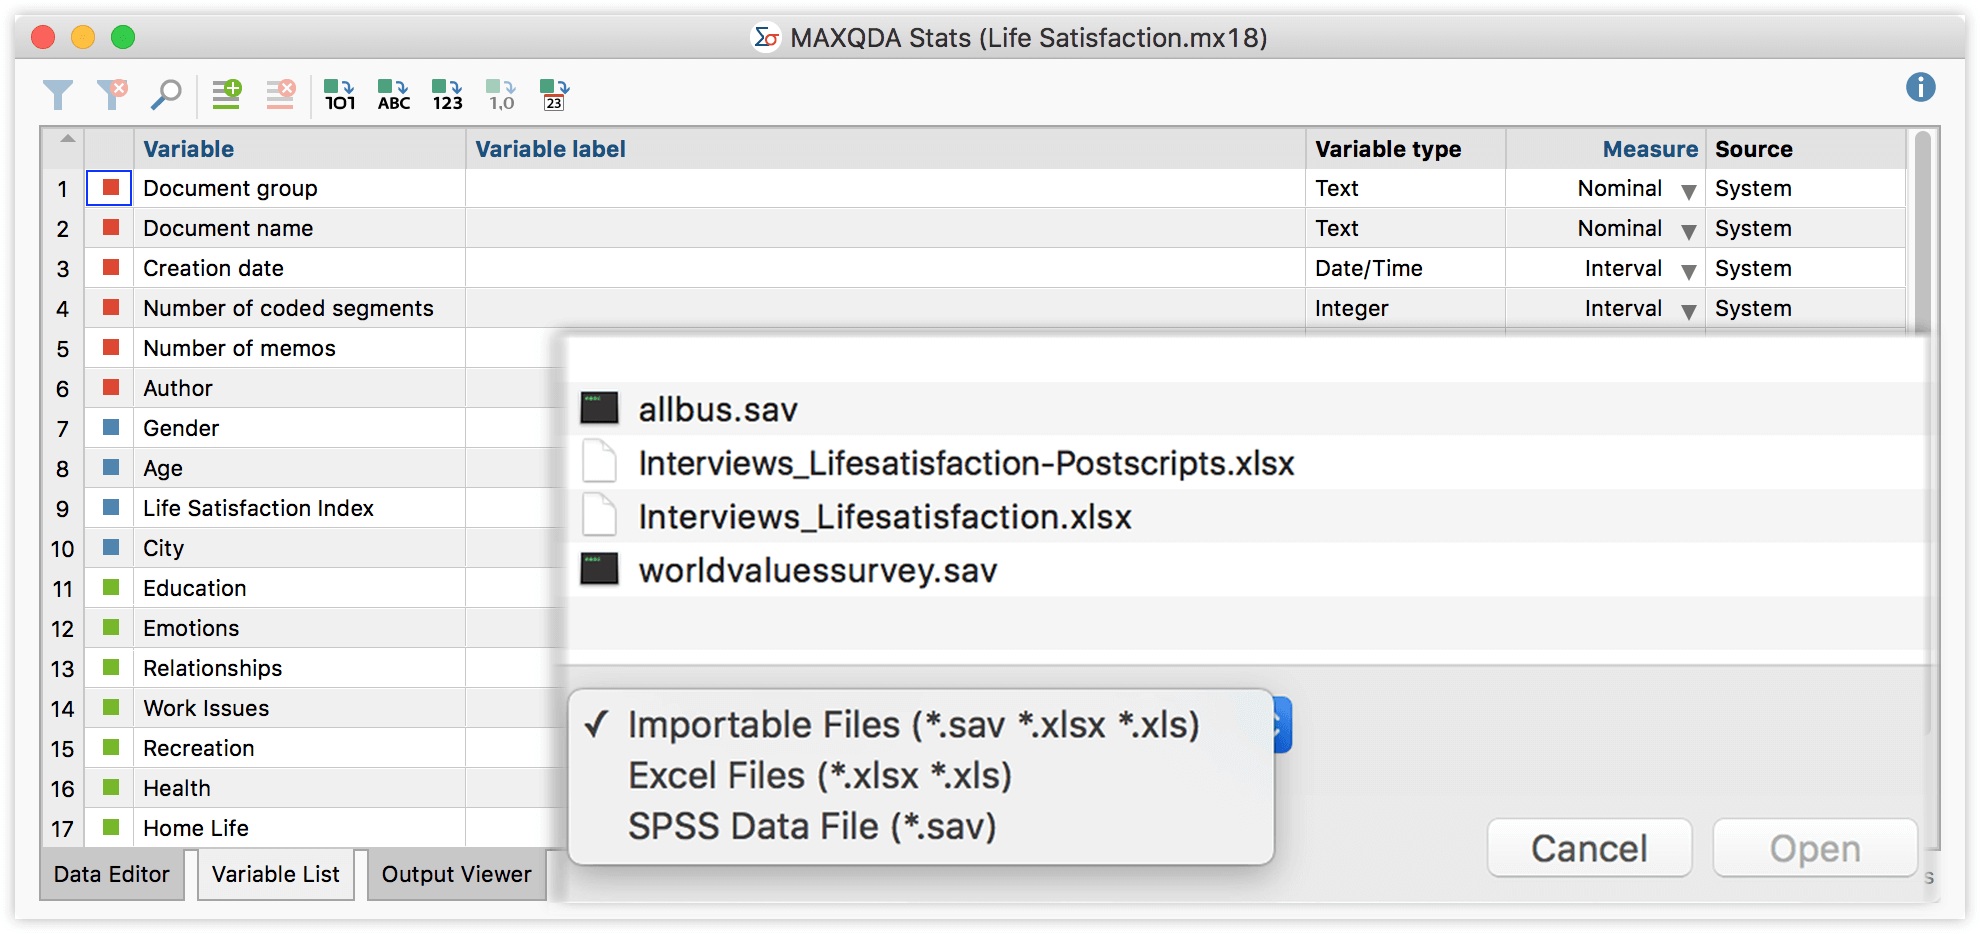
Use the Stats module to run statistical calculations with your MAXQDA project data. Statistically analyze code frequencies across documents and create new data groups in your qualitative project based on statistical results.
Include all parts for your data or use activation to limit the analysis to specific documents and codes. You can also work with Excel or SPSS data sets – just like you would in any other statistics software package.
Descriptive Statistics
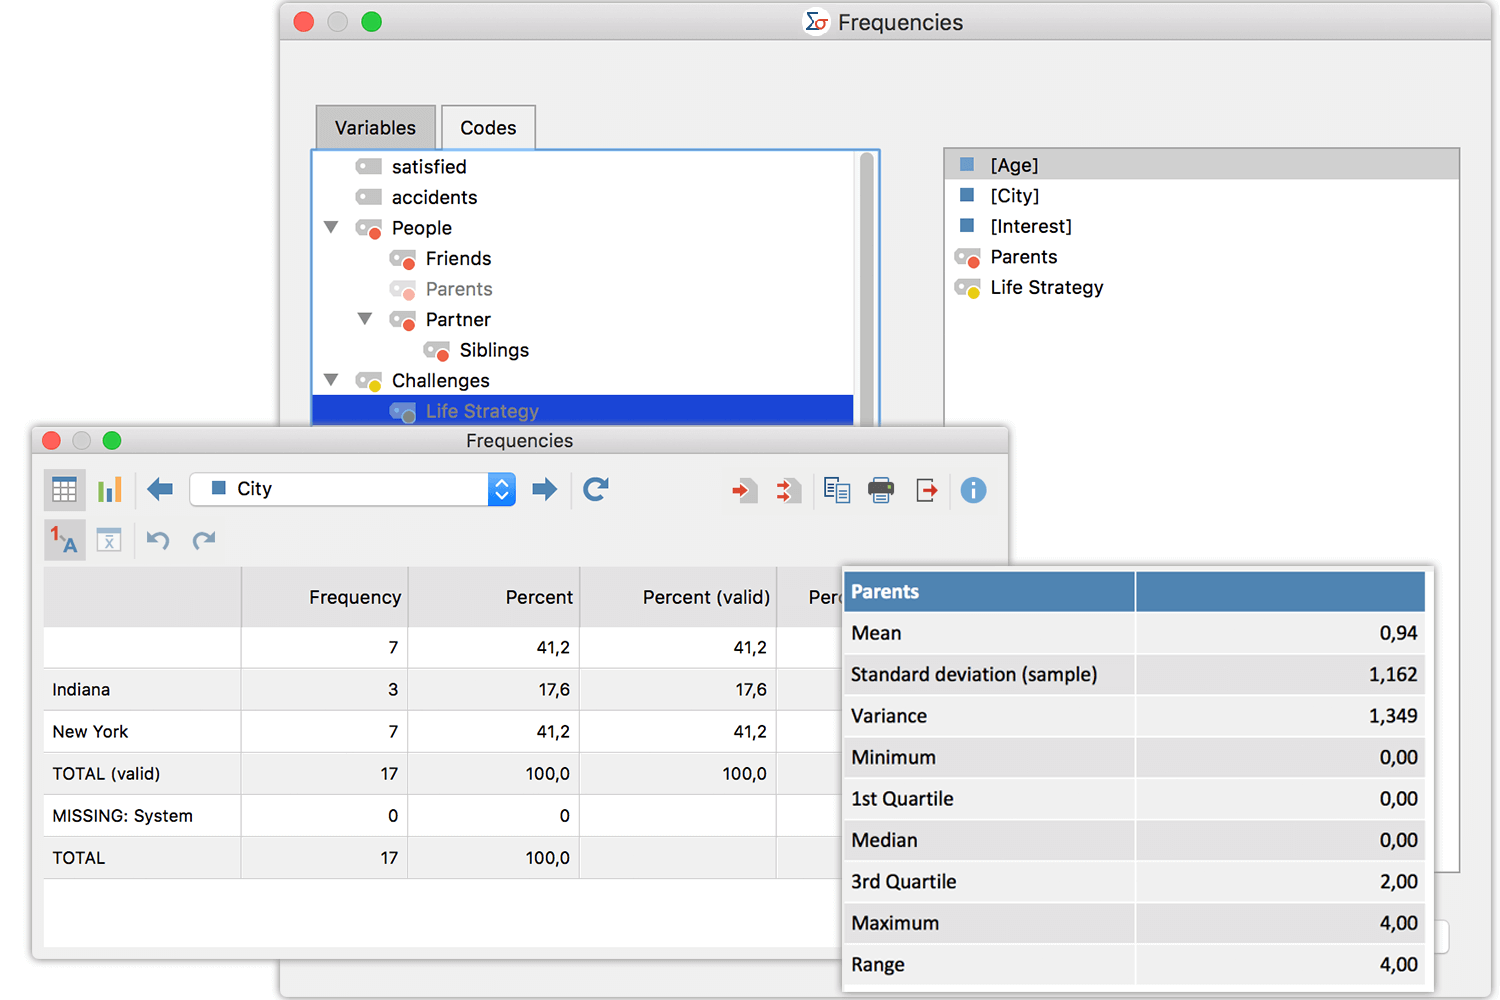
Create basic charts to compare frequency and percentages for variables or codes. Frequency tables are interactive – remove and merge columns or rows with automatic recalculation of percentages. Create customizable charts and diagrams for your results and copy to output viewer or directly to your reports and presentations.
Calculate descriptive statistics including mean, standard deviation, variance, quartiles, median and range.
Compare Groups
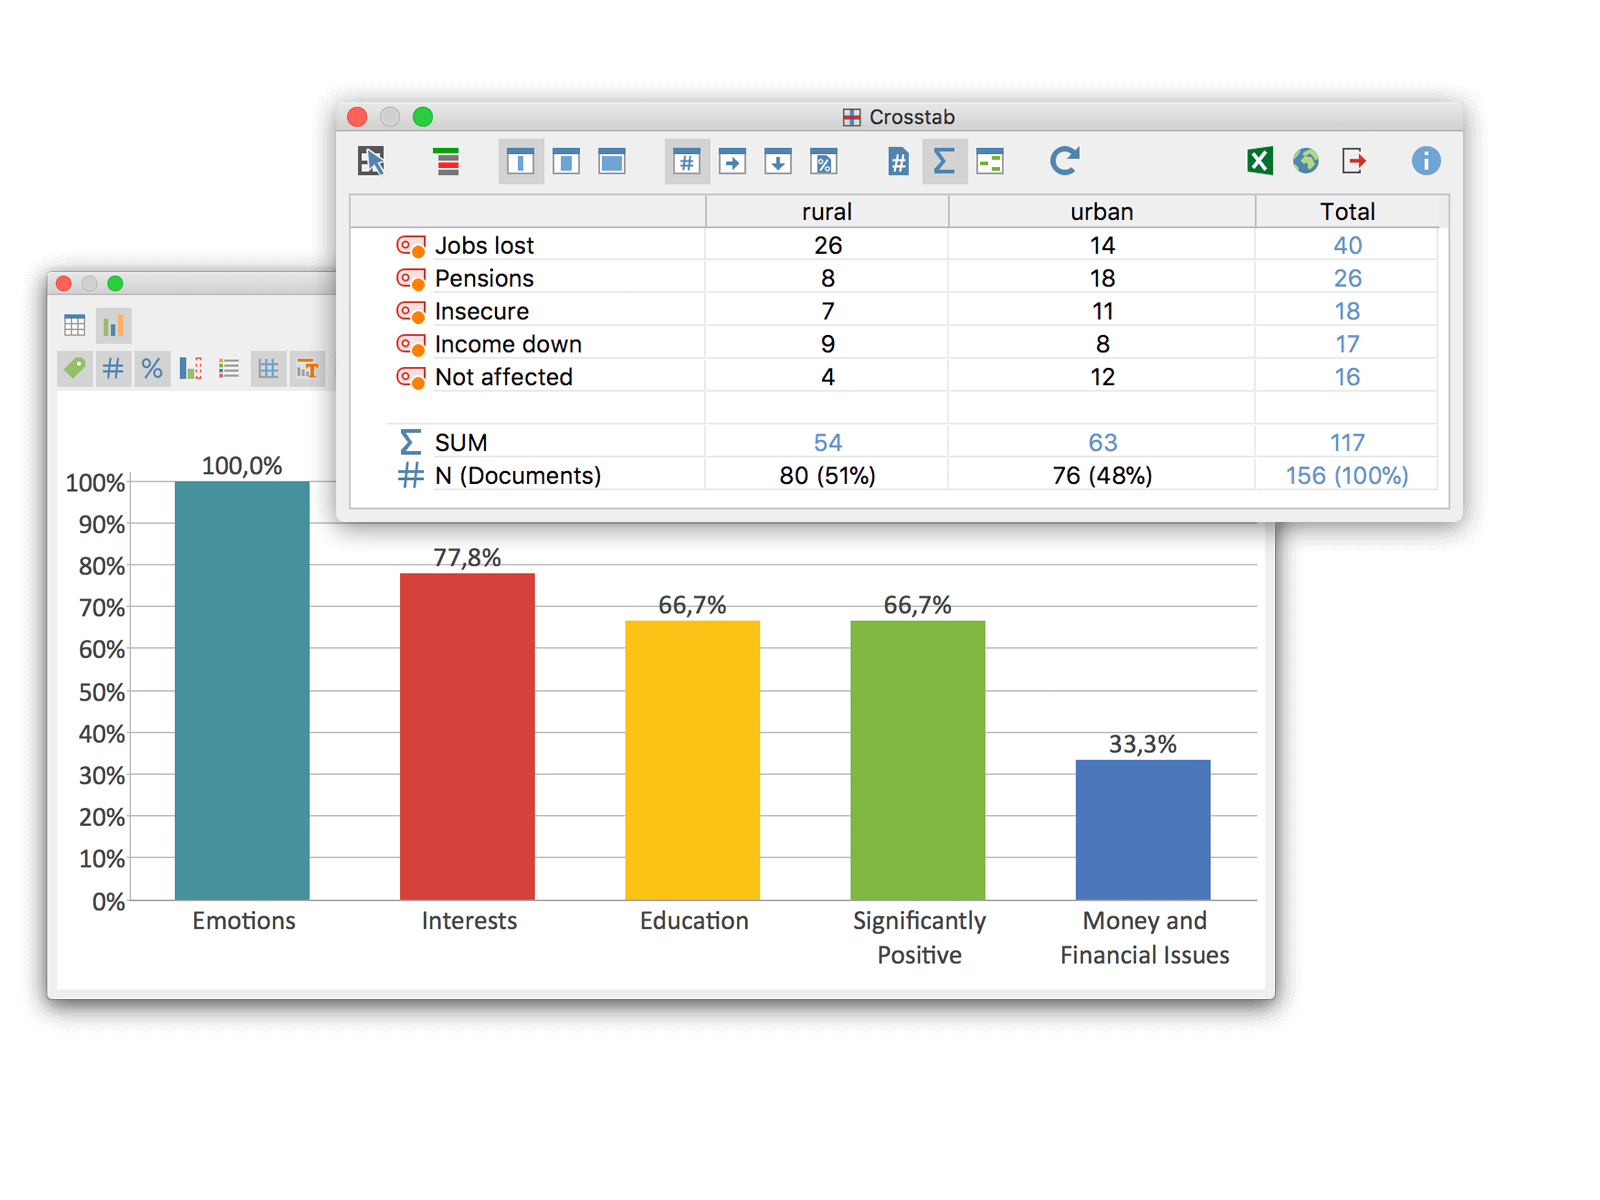
There is a wide variety of methods to explore relationships between two or more variables. Crosstabs are one of the basics that no statistics program can do without: they’re easy to customize and can provide valuable insights for everzone – not just statisticians. Highlighting options make the interpretation of results quick and easy.
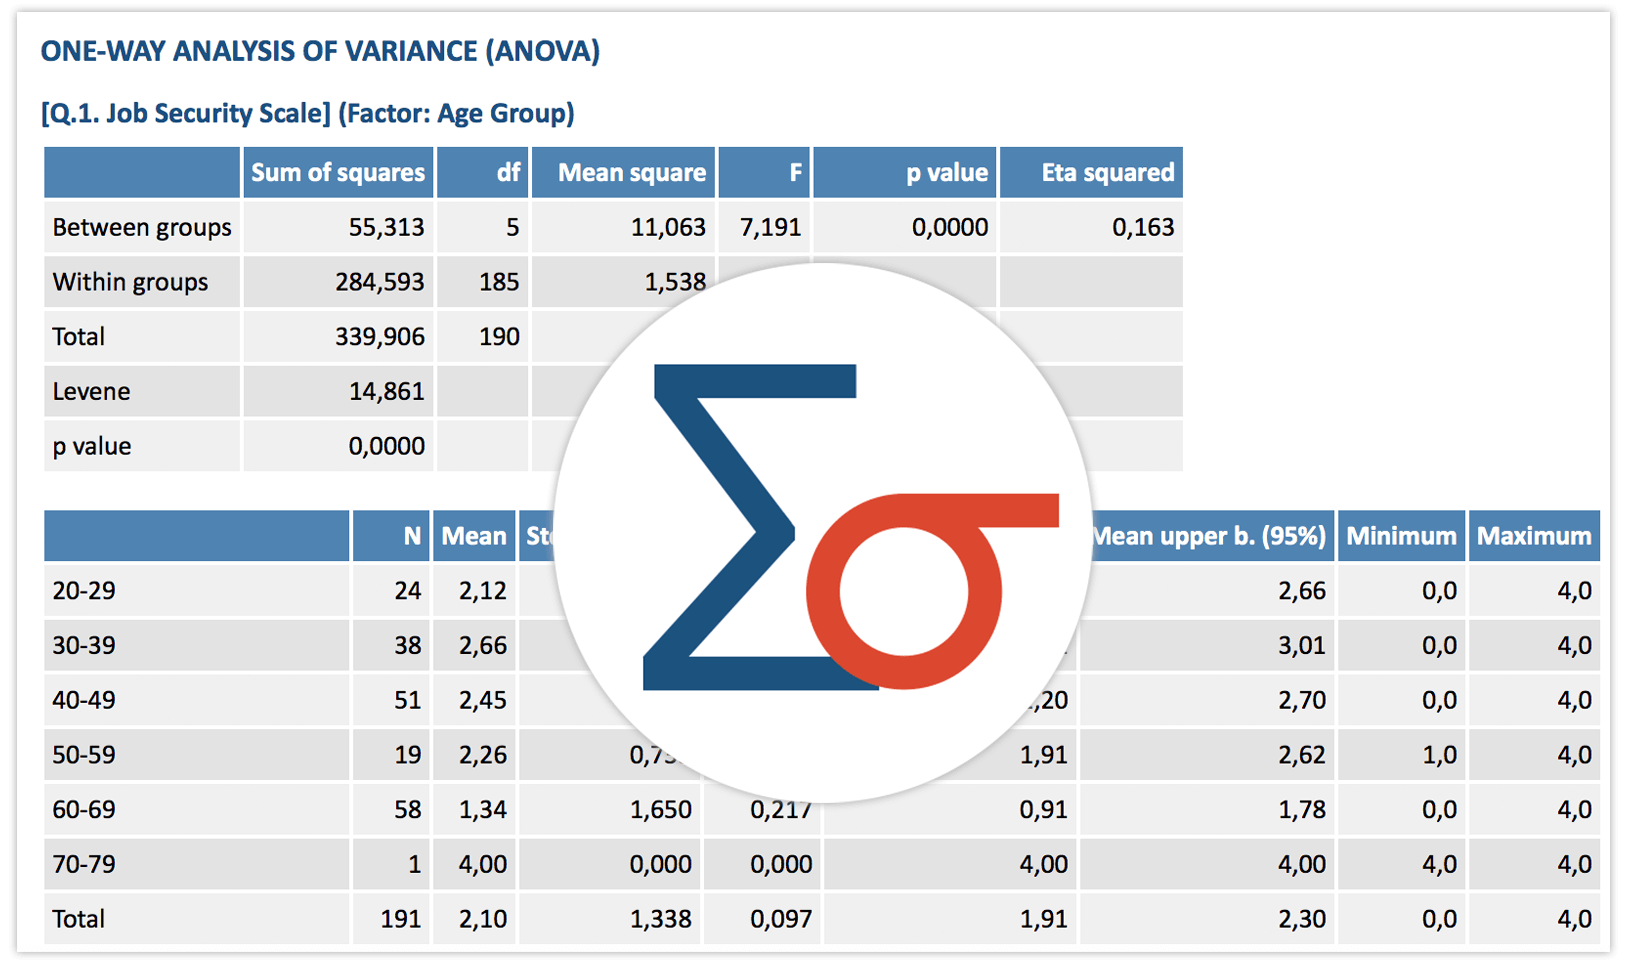
If you’re looking for something more advanced, you can also compare the effect of a factor on different groups with an analysis of variance (ANOVA).
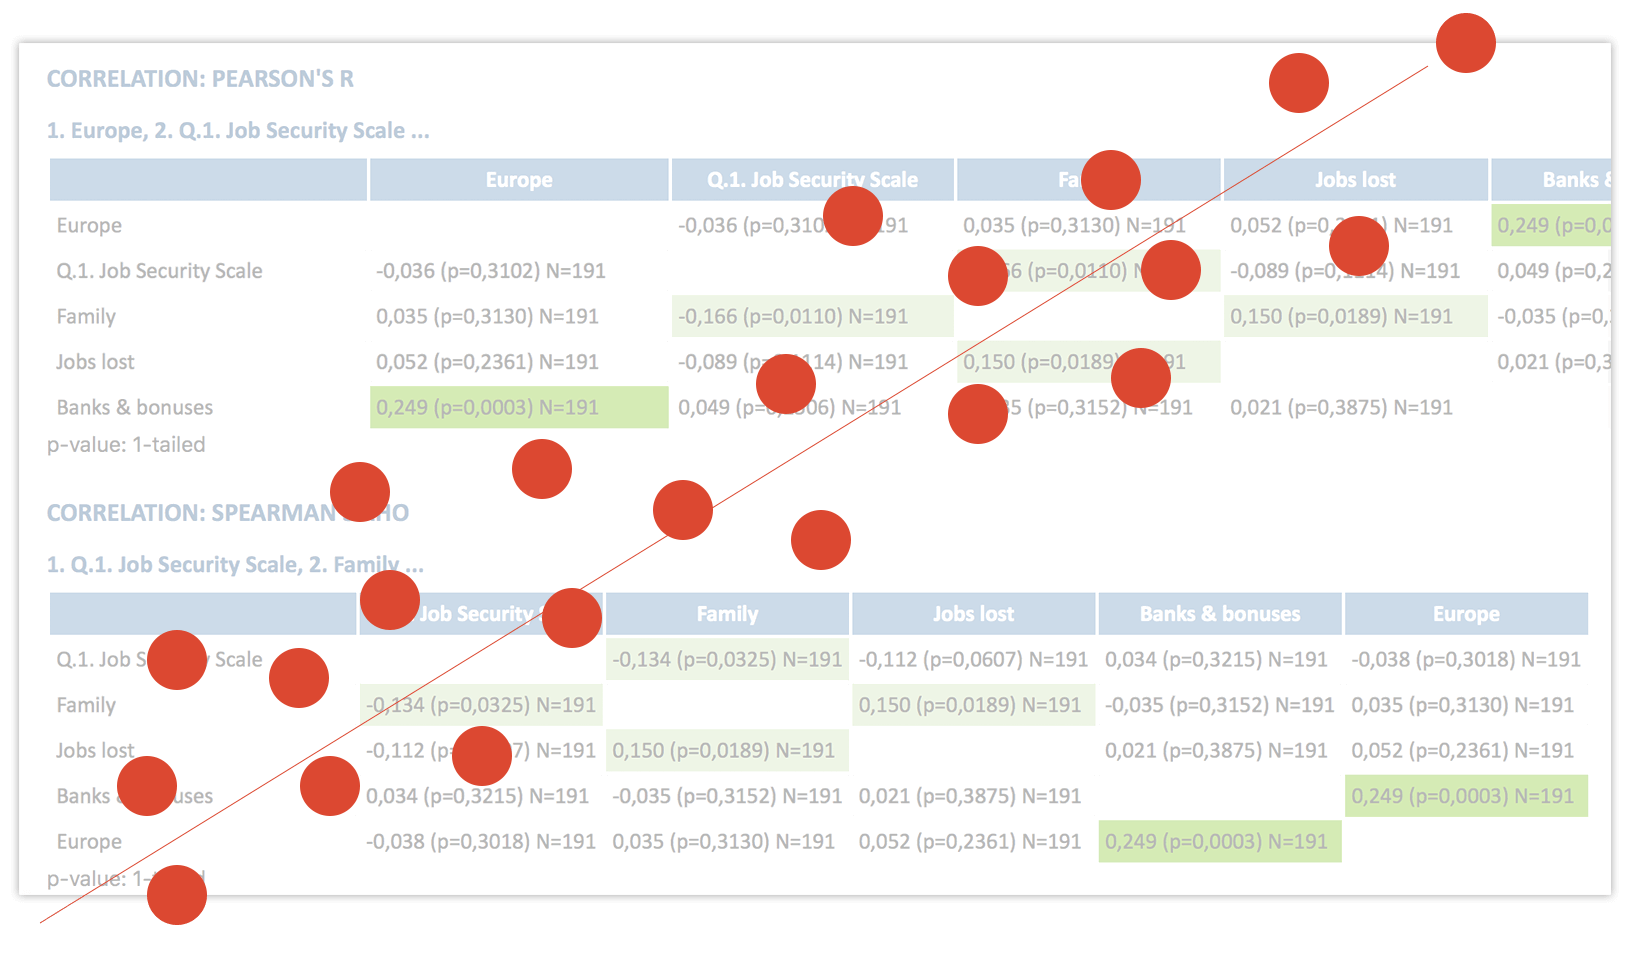
Correlation
One of the most fundamental statistical procedures to explore connections within your data is to check for correlations. The Stats module enables you to calculate the two most commonly used correlation coefficients with a few mouse clicks: Pearsons r and Spearmans Rho.
Scale, Compute & Recode
Creating your own scale can be a great way to properly measure the dimensions that you are most interested in. Calculate Cronbachs Alpha to check reliability. Save scales as new variables and calculate the sum or mean of the item values.
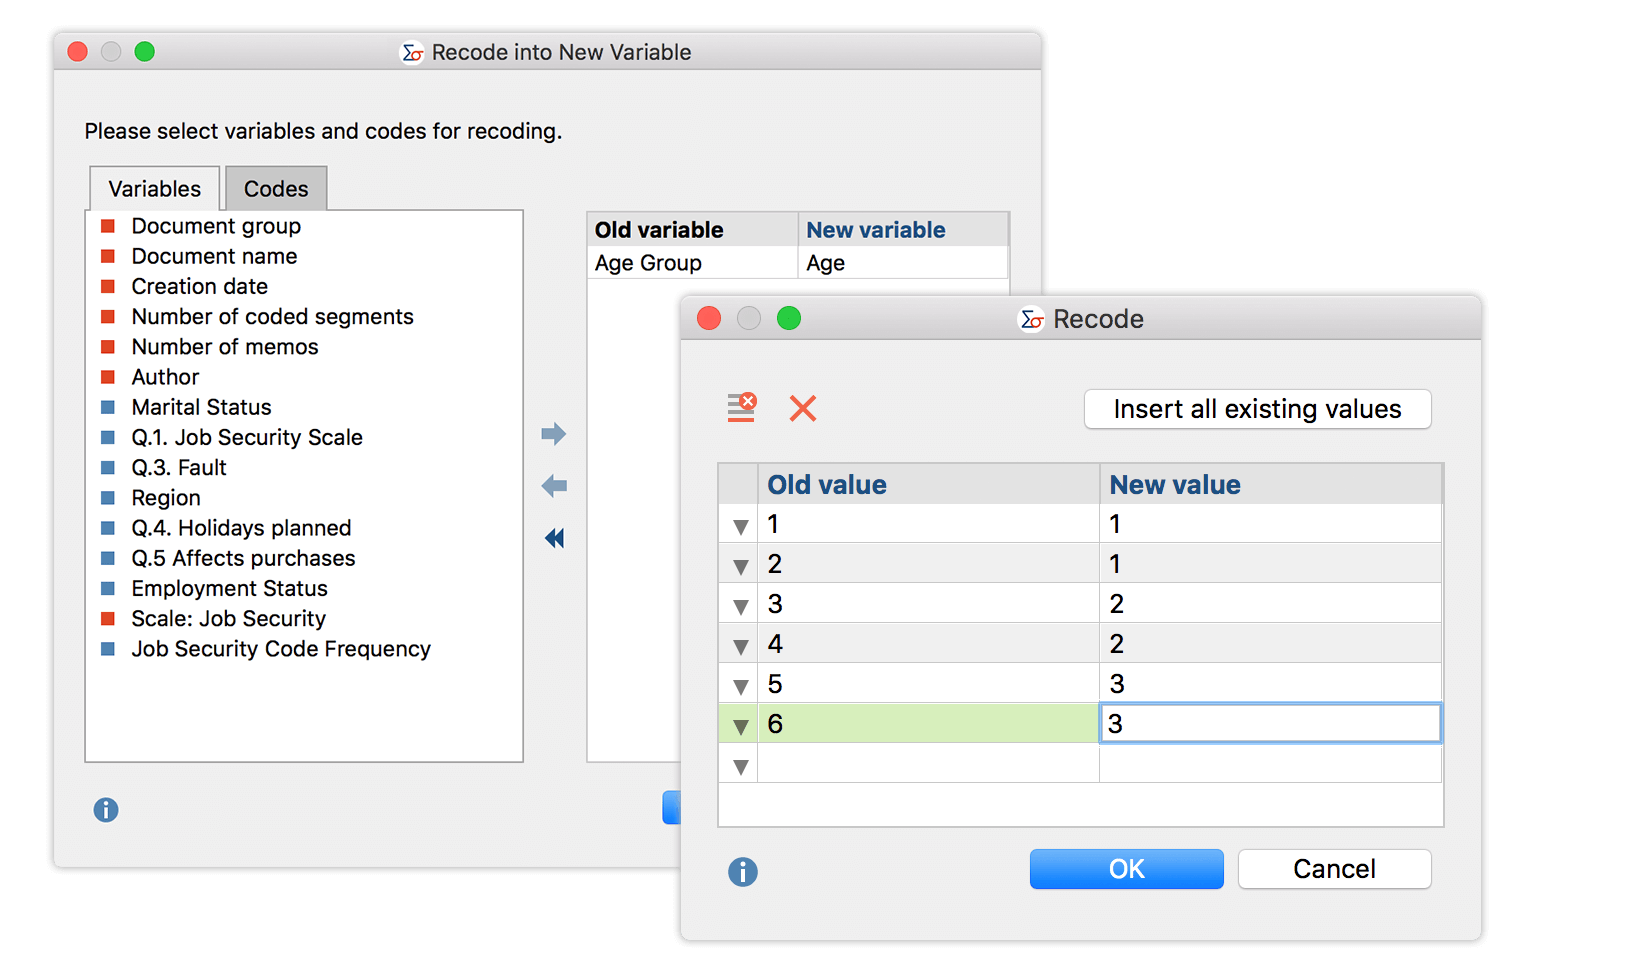
Create new variables by computing or recoding existing variable values.
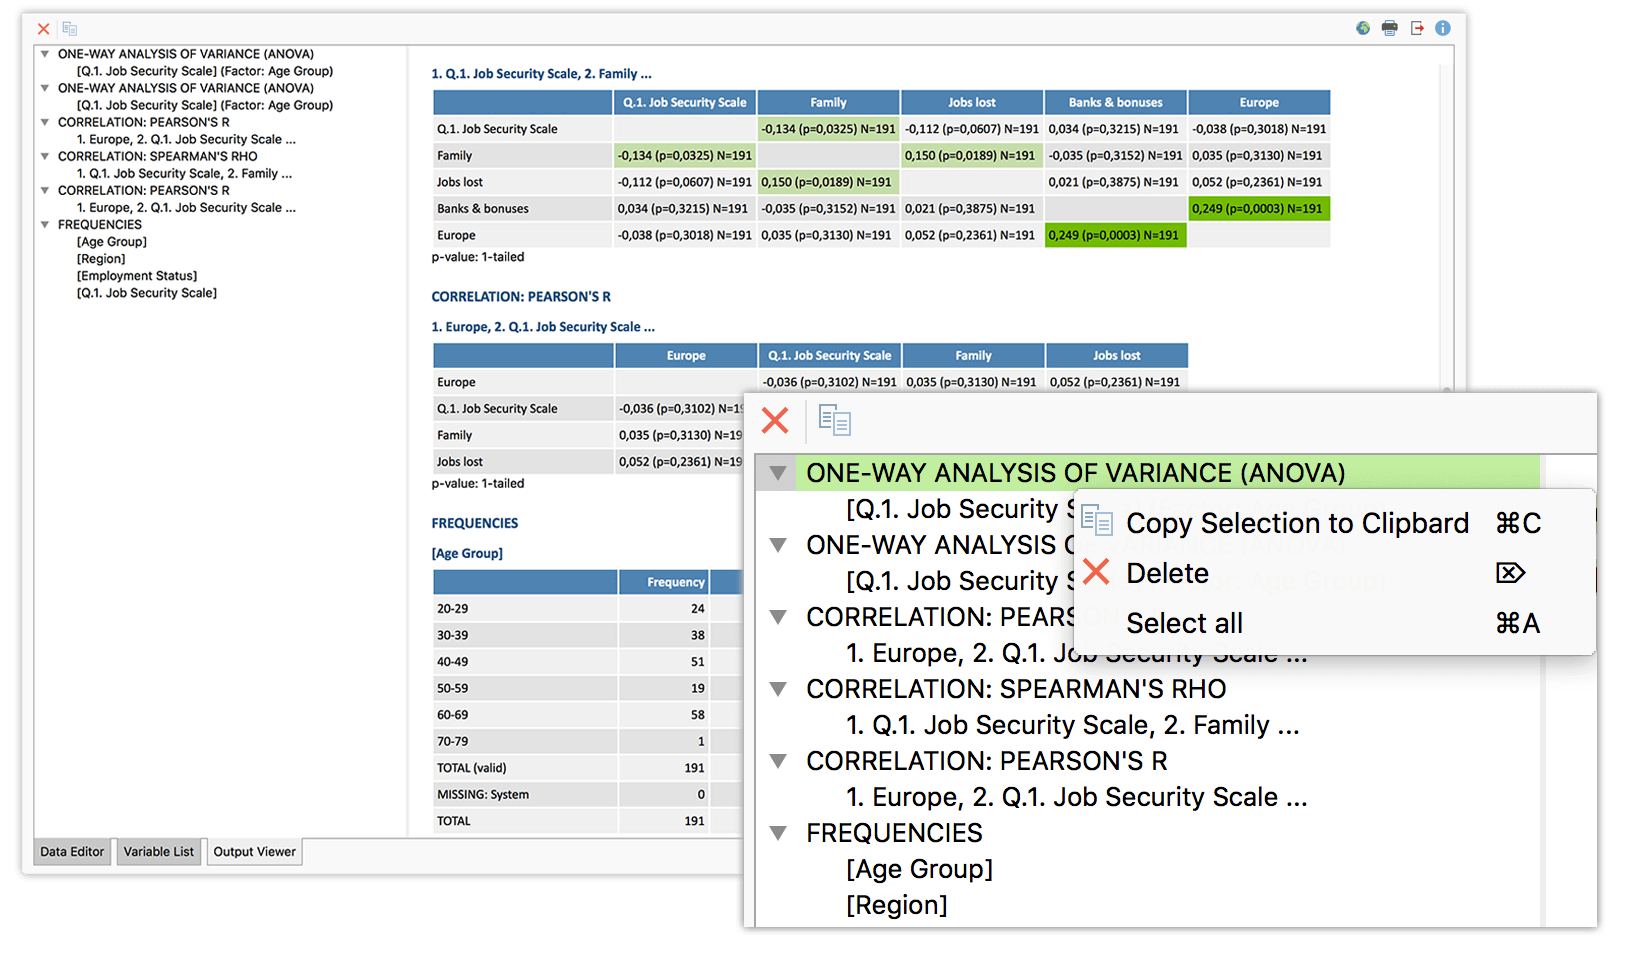
User Friendly Output Viewer
Ease of use has always been recognized as a strong trait of the MAXQDA product family, and with MAXQDA Analytics Pro we extend our high standard of usability into the realm of statistical analysis. The integrated output viewer is just one of the many features we’ve implemented to fulfill this promise, but it’s a central one: export every table and every chart to the output viewer with just one click. It will stay there, no matter what you do in the meantime – waiting to be transferred into your report with a simple copy & paste.